A rounding bottom chart pattern can signify a continuation or a reversal. For instance, during an uptrend an asset’s price may fall back slightly before rising once more. This would be a bullish continuation.
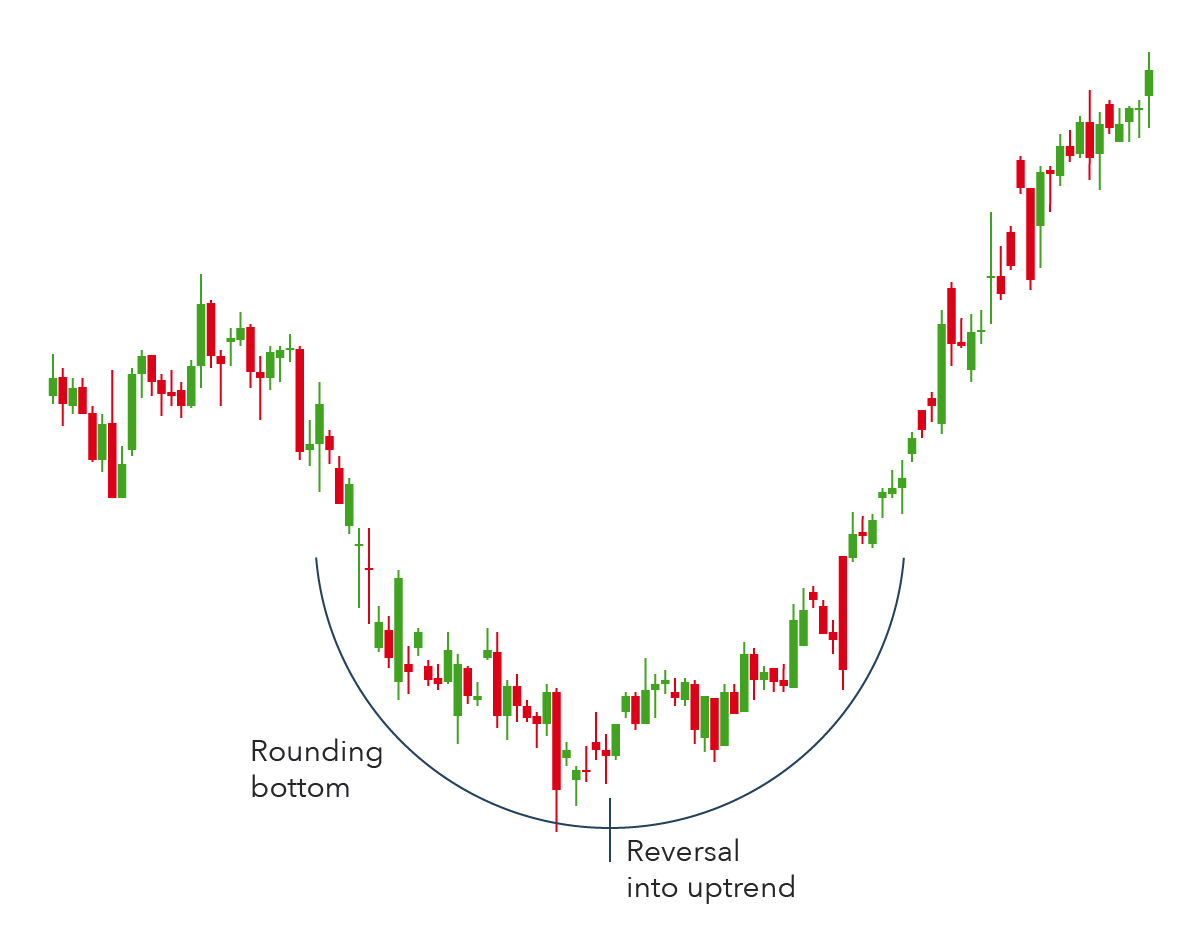
An example of a bullish reversal rounding bottom – shown below – would be if an asset’s price was in a downward trend and a rounding bottom formed before the trend reversed and entered a bullish uptrend.
Video :